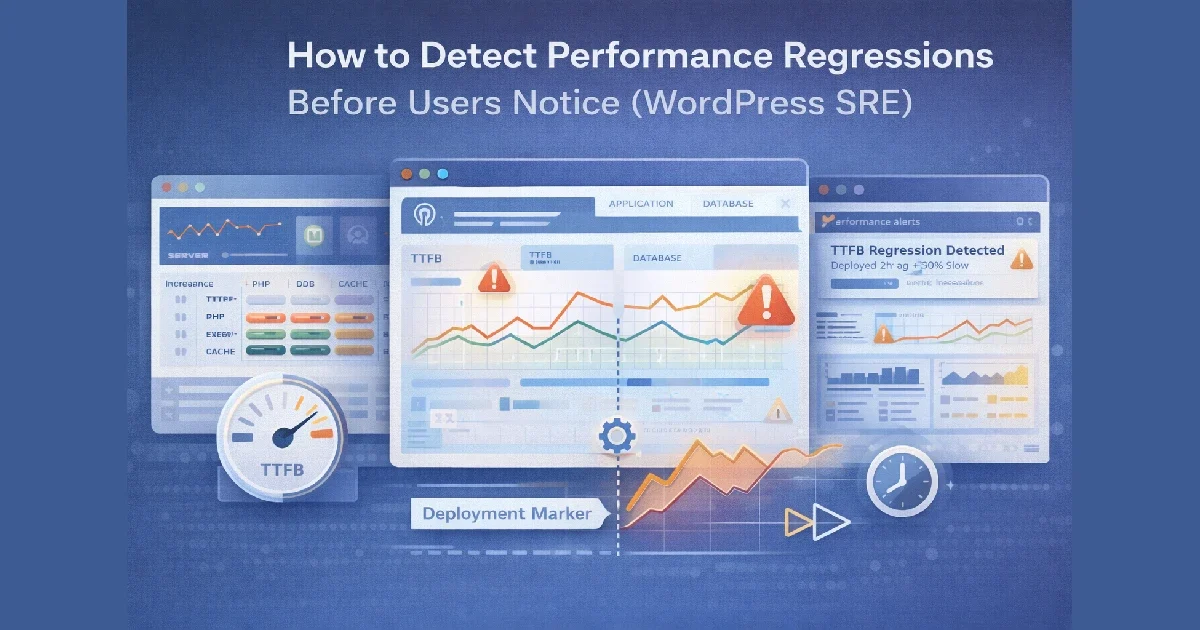
Performance regressions rarely announce themselves clearly. They usually arrive quietly — a slightly slower TTFB, a gradual rise in PHP execution time, a creeping increase in database latency. By the time users complain, the regression has already existed for days or weeks.
In Site Reliability Engineering (SRE), the goal is not just to respond to incidents, but to detect degradation early and prevent it from becoming user-visible.
At Wisegigs.eu, we treat WordPress performance regressions as reliability signals, not one-off bugs. This article explains how WordPress hosting teams can detect regressions before users feel them, using SRE principles, observability, and disciplined monitoring.
1. What a Performance Regression Really Is
A performance regression is not an outage. It’s a negative trend.
Examples:
TTFB increases by 100–200ms after a deployment
PHP worker utilization slowly rises week over week
Cache hit ratio drops after a plugin update
Database query latency increases during peak hours
INP worsens even though page speed scores look “fine”
These changes are often subtle — but they compound.
Google’s SRE Book emphasizes that most incidents begin as slow-burn regressions, not sudden failures:
https://sre.google/sre-book/
2. Why WordPress Teams Miss Regressions
Many WordPress environments lack the signals needed to see regressions early.
Common causes:
Monitoring only uptime, not latency
No historical baselines
Alerts tuned for outages, not degradation
No correlation between deploys and metrics
Performance checks only on homepage
Relying on synthetic tools alone
By the time “the site feels slow,” the regression has already escaped.
At Wisegigs.eu, regression detection always starts with trend visibility, not alert spam.
3. Define the Right Performance Signals (SLIs)
You can’t detect regressions without defining what “good” looks like.
Core WordPress performance SLIs:
TTFB (Time to First Byte)
PHP execution time
Database query latency
Cache hit ratio (page + object)
CPU saturation
Memory pressure / swap usage
Error rate (4xx/5xx)
These signals represent user-perceived performance, not vanity metrics.
Cloudflare highlights that latency-based signals reveal problems long before availability drops:
https://www.cloudflare.com/learning/performance/
4. Establish Baselines (This Is Non-Negotiable)
Regression detection requires comparison.
Baselines should include:
Normal daily patterns
Peak traffic behavior
Off-peak behavior
Known “healthy” periods
Without baselines:
Alerts are meaningless
Engineers argue over “normal”
Small regressions go unnoticed
Baselines allow you to ask:
“Is this slower than usual for this time and load?”
5. Track Changes, Not Just Absolute Thresholds
Static thresholds miss gradual degradation.
Bad alert:
“Alert if TTFB > 2s”
Better alert:
“Alert if TTFB increases 30% compared to 7-day baseline”
This approach catches:
Plugin updates that add overhead
Cache regressions
Database bloat
PHP configuration drift
DigitalOcean’s monitoring guides stress trend-based alerts over fixed thresholds:
https://www.digitalocean.com/community/tutorials
6. Correlate Performance With Deployments
Most regressions are change-induced.
Track these events alongside metrics:
Plugin updates
Theme updates
PHP version changes
Config changes
Infrastructure changes
Traffic pattern shifts
Without correlation, teams waste time guessing.
At Wisegigs.eu, every deployment leaves a visible “marker” in monitoring dashboards so regressions are immediately traceable.
7. Monitor Cache Effectiveness (Not Just Cache Status)
“Cache enabled” doesn’t mean “cache effective.”
Regression signals:
Page cache hit ratio drops
Object cache eviction spikes
Cache bypass increases for anonymous users
Logged-in traffic increases unexpectedly
Redis documentation notes that declining hit ratios are often the earliest sign of performance regression:
https://redis.io/docs/
Cache regressions are silent killers in WordPress.
8. Use Synthetic + Real-User Signals Together
Each signal type catches different regressions.
Synthetic monitoring catches:
Cold cache performance
DNS or SSL delays
External dependency issues
Real user metrics catch:
JavaScript delays
INP regressions
Mobile-only issues
Regional slowdowns
Google’s Web Vitals guidance emphasizes combining lab and field data to detect real user impact:
https://web.dev/vitals/
9. Detect Regressions Before Alerts Fire
The best SRE teams don’t wait for alerts.
Early-warning indicators:
Gradual CPU growth without traffic growth
Increasing PHP queue wait times
Rising database lock duration
Increasing cache rebuild frequency
Longer cron execution times
These are leading indicators, not symptoms.
At Wisegigs.eu, weekly regression reviews are standard — not optional.
10. Turn Regression Detection Into a Habit
Regression detection should be operationalized.
Recommended practices:
Weekly performance trend review
Post-deploy metric comparison
Monthly baseline refresh
Regression-focused dashboards
Clear ownership of performance metrics
SRE culture treats regressions as reliability debt — not technical noise.
Conclusion
Performance regressions are inevitable — unnoticed regressions are not. With the right signals, baselines, and SRE mindset, WordPress teams can detect slowdowns early, fix them cheaply, and protect user experience before complaints begin.
To recap:
Define latency-focused SLIs
Establish real baselines
Alert on trends, not just thresholds
Correlate performance with changes
Monitor cache effectiveness
Combine synthetic and real-user data
Review performance regularly
Want proactive performance regression detection for your WordPress stack? Contact Wisegigs.eu.
