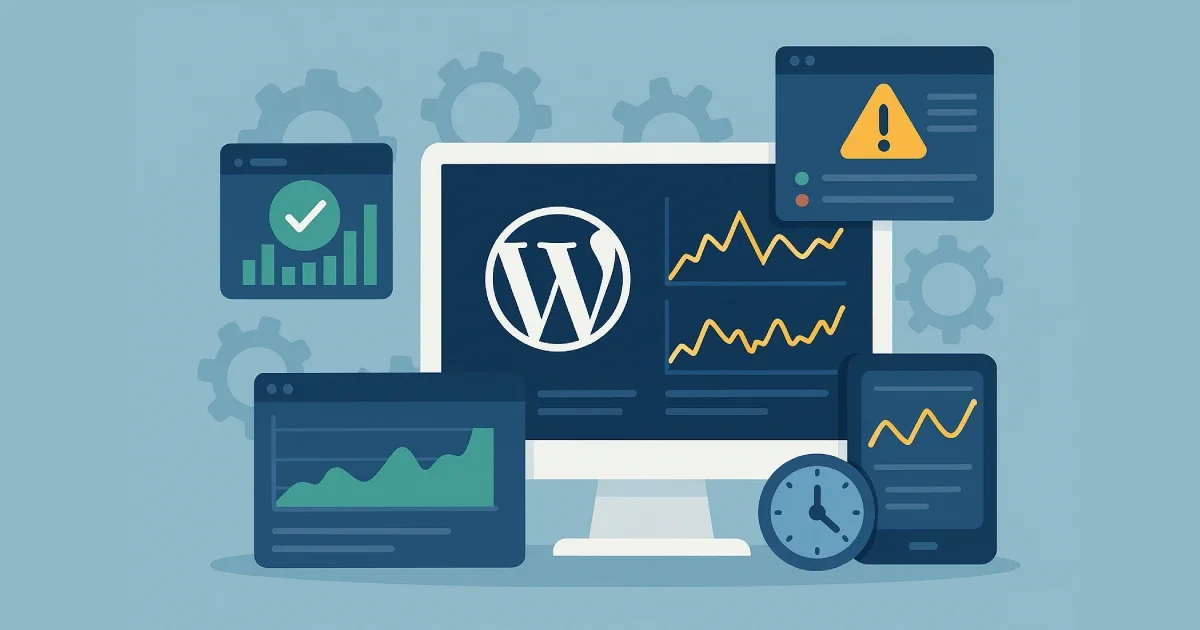
Keeping a WordPress site fast and stable requires ongoing visibility into performance, uptime, and user experience. Many site owners assume that stability comes purely from hosting or plugins, but long-term reliability depends on continuous monitoring and structured operational habits. You don’t need to be technical to understand these concepts—just consistent with how you observe your system.
At Wisegigs.eu, we apply lightweight SRE-inspired monitoring practices to help teams avoid issues before they affect users. This tutorial breaks down the essentials into simple steps and “snippets” of guidance—no code required.
1. Start With Clear Monitoring Goals
Before you begin tracking anything, define what matters most to your WordPress website. Clear goals ensure your monitoring efforts stay focused and useful.
Typical goals include:
-
Detect slowdown early
-
Prevent resource bottlenecks
-
Identify plugin-related issues
-
Track uptime
-
Understand user experience
-
Monitor traffic spikes
-
Spot errors before customers do
Google’s SRE guidance emphasizes monitoring only meaningful signals, not everything at once:
Clear goals ensure you track only the data that helps you take appropriate action.
2. Monitor Server Health Without Technical Tools
Your server’s condition is a major factor in how well WordPress performs. You don’t need command-line experience to understand the basics.
Key server indicators to watch:
-
CPU load (general server strain)
-
RAM usage (capacity to handle multiple processes)
-
Disk space (prevents outages from full storage)
-
Disk activity (affects database speed)
-
Network activity (traffic surges)
-
PHP worker usage (affects concurrency)
Even non-technical users can check these from their hosting dashboard.
At Wisegigs.eu, we also track server-level trends internally to catch slow growth in resource usage before they become performance problems.
3. Ensure Uptime Monitoring Is Always Active
Uptime monitoring tells you when your website becomes unreachable. A few minutes of downtime can hurt conversions, user trust, and search performance.
Your monitor should track:
-
Downtime incidents
-
Slow response times
-
Geographic performance differences
-
Unexpected surges and drops
Use tools that notify you instantly, not hours later. Many issues resolve quickly when caught early.
4. Observe WordPress Application Behavior
Many performance issues happen inside WordPress, not on the server. Application monitoring shows you how plugins, themes, and scheduled tasks behave.
Watch for:
-
Plugin conflicts
-
Slow database queries
-
Failed background tasks
-
High memory usage from themes
-
Errors generated by third-party tools
You don’t need to install a full APM tool—just being aware of what can go wrong helps you choose the right tools and services.
5. Track Database Health Regularly
The database powers everything from posts to settings. When it slows down, your entire site slows down with it.
Key areas to monitor:
-
Growth of tables
-
Query speed trends
-
Excessive revisions or logs
-
Plugin-generated overhead
-
Database connection limits
Healthy database behavior ensures your site loads consistently even during peak traffic.
6. Analyze Real User Experience (RUM)
Synthetic tests show theoretical speed. Real User Monitoring (RUM) shows real-world behavior from actual visitors.
Important RUM indicators:
-
Largest Contentful Paint (LCP)
-
First Input Delay (FID)
-
Interaction to Next Paint (INP)
-
Layout shifts
-
Mobile responsiveness
RUM helps you focus on the issues your visitors actually experience, not just what tools simulate.
7. Observe Errors and Logs Without Reading Code
You don’t need to understand every error log. What matters is spotting patterns.
Helpful log types include:
-
Application logs
-
PHP error logs
-
Server access logs
-
Security logs
-
Plugin error logs
-
Cron (scheduled task) logs
Look for repeating messages, warnings, or anything marked “critical.” These usually point to areas needing attention.
8. Set Alert Rules That Prevent Overwhelm
Monitoring is only meaningful if you receive timely alerts. But too many alerts create fatigue, causing you to ignore them.
Focus alerts on:
-
Downtime
-
High error rates
-
Slow performance
-
Database saturation
-
Sudden traffic changes
-
Server resource exhaustion
SRE teams emphasize alerting only on actionable problems—not every small anomaly.
At Wisegigs.eu, we fine-tune alerts so that teams receive only what matters.
9. Review Monitoring Reports for Long-Term Stability
Monitoring isn’t just reactive. Reviewing monthly or weekly trends helps you prevent issues before they appear.
Look for trends such as:
-
Seasonal traffic spikes
-
Slower load times over time
-
Plugin updates causing new issues
-
Increased server resource usage
-
Repeating errors
-
Growth of database tables
Trend analysis is one of the most overlooked parts of maintaining a healthy WordPress environment.
Conclusion
Monitoring WordPress doesn’t have to be technical. With a structured routine, clear goals, and simple tools, you can prevent downtime, catch problems early, and improve performance across your site.
Focus on these essentials:
-
Define your monitoring goals
-
Track server health
-
Monitor uptime
-
Watch WordPress behavior
-
Check database health
-
Analyze real user experience
-
Observe logs
-
Use intelligent alerts
-
Review long-term patterns
These steps ensure your WordPress site remains stable, predictable, and user-friendly—even as traffic grows.
Need help setting up a reliable monitoring system? Contact us today.
